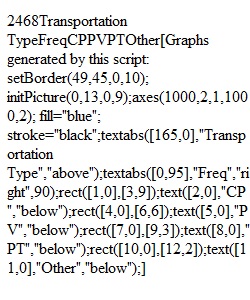


Q Question 1. Version 2*/2. Score: 9/12Expand Part 1 of 4 To analyze how Arizona workers ages 16 or older travel to work (carpool, private vehicle, public transportation, other), data from 20 workers were collected and are shown in the table below. Carpool Carpool Carpool Private Private Private Other Private Other Carpool Carpool Carpool Private Public Private Public Public Carpool Carpool Carpool ________________________________________ Complete the frequency/relative frequency table. Transportation Type Frequency Relative Frequency Carpool Incorrect Incorrect Private Correct Correct Public Correct Incorrect Other Correct Correct Part 3 of 4 Which of the following is the correct bar chart for the given data? Part 4 of 4 Which of the following is the correct pie chart for the given data? • Question 2. Version 2*/2. Score: 10/12Expand Part 1 of 4 Most Connecticut households use gas, fuel oil, or electricity as a heating source. A random sample of 20 Connecticut households was taken and the type of heating source was recorded for each. The data are in the table below. Electricity Electricity Electricity FuelOil FuelOil FuelOil Gas Other Gas Electricity Electricity FuelOil Gas Electricity FuelOil FuelOil FuelOil Electricity Gas Gas ________________________________________
View Related Questions